FFT Strategy Bi-Directional Stop/Profit/Trailing + VMA + AroonThis strategy uses the Fast Fourier Transform inspired from the source code of @tbiktag for the Fast Fourier Transform & @lazybear for the VMA filter.
If you are not familiar with the Fast Fourier transform it is a variation of the Discrete Fourier Transform. Veritasium on youtube has a great video on it with a follow up recommendation from 3brown1blue. In short it will extract all the frequencies from a set of data. @tbiktag laid the groundwork for creating the indicator which will allow you to isolate only those signals which are the most relevant and remove the noise. I recommend having @tbiktag's FFT Transform indicator side by side with this to understand what my variation is doing by setting similar settings .
Using this idea, you can then optimize a strategy to the frequencies that are best. The main entry signal is when the FFT Signal crosses above or below the 0 line .
Included with this strategy is the ability to optionally bi-directionally set:
Stop Loss
Trailing Stop Loss
Take Profit
Trailing Take Profit
Entries are optionally further filtered by use of the VMA using the algorithm from LazyBear which allows you to adjust a variable moving average with 3 market trend detections. Green represents upwards momentum; Blue sideways trading and Red downwards momentum. The idea being to filter out buy or sell entries unless the market is moving in that direction, and this makes a big difference as you can see for yourself when you turn it off or on. Turning it off will change the color of the FFT signal to orange instead of the green, blue, red colors .
I have added 2 custom stop loss types as well for experimentation:
1. VMA Filter stop loss to exit the trade if the VMA detects a market trend direction change matching the rules you have set. I have set this to off by default, but it is there so you can see what affect it may have on other tickers. It can increase the profit factor but usually at a cost of net profit.
2. The Aroon Filter stop loss with different lengths for the short or long direction. For the Aroon strategy (which is a trend change detector) it is considered bullish if the upper line (green in my code) is above 70 and the lower line (red in my code) is below 30 and the opposite for the bearish case. With this in mind, I have set it to filter by default only the extreme ends (99 and 1) to increase profit factor and net profit but I encourage you to try different settings and see how it affects things. Turning this off yields much higher net profit but at the cost of the profit factor and drawdown . To disable this just uncheck the 'Use Aroon Filter Long' (or short) and it will also hide the aroon graphics and crosses on the plot.
I will be adding more features in an attempt to lower the drawdown on this strategy but I hope you enjoy what I have so far!
Cari dalam skrip untuk "Trailing stop"

R:R Trading System FrameworkFirst off, huge thanks to @fikira! He was able to adapt what I built to work much more efficiently, allowing for more strategies to be used simultaneously. Simply put, I could not have gotten to this point without you. Thanks for what you do for the TV community. Second, I am fairly new to pinescript writing, so I welcome criticism, thoughtful input and improvement suggestions. I would love to grow this concept into something even better, if possible. So please let me know if you have any ideas for improvement. However I do juggle a lot of different things outside of TV, so implementations may be delayed.
I have decided, at this time, not to add alerts. First, because I feel most people looking to adapt this framework can add their own pretty easily. Also, given how customized the framework is currently, while also attempting to account for all the possible ways in which people may want alerts to function after they customize it, it seems best to leave them out as it doesn't exactly fit the idea of a framework.
For best viewing, I recommend hovering over the script's name > ... > Visual order > Bring to front. Also I found hollow candles with mono-toned colors (like pictured) are more visually appealing for me personally. I HIGHLY RECOMMEND USING WITH BAR REPLAY TO BETTER UNDERSTAND THE FRAMEWORK'S FUNCTIONALITY.
▶️ WHAT THIS FRAMEWORK IS
- A huge collection of concepts and capabilities for those trying to better understand, learn, or teach pinescript.
- A system designed to showcase Risk:Reward concepts more holistically by providing all of the most popular components of retail trading to include backtesting, trade visual plotting, position tracking, market condition shifts, and useful info while positioned to help highlight changes in your risk:reward based decision-making processes.
- A system that can showcase individual strategies regardless of trade direction, allowing you to develop hedging strategies without having multiple indicators that do not correlate with each other.
- Designed around the idea that you trade less numbers of assets but manage your positions and risk based on multiple concurrently running strategies to manage your risk exposure and reward potential.
- An attempt to combine all the things you need to execute with an active trading management style.
- A framework that uses backtested results (in this case the number of averaged bars it takes to hit key levels) in real-time to inform your risk:reward decision-making while in-trade (in this case in your Trade Tracking Table using dynamic color to show how you might be early, on-time, or late compared to the average amount of backtested time it normally takes to hit that specific key level).
▶️ WHAT THIS FRAMEWORK IS NOT
- A complete trading product. DO NOT USE as-is. It is a FRAMEWORK for you to generate ideas of your own and fairly easily implement your own triggering conditions in the appropriate sections of the script.
▶️ USE CASES
- If you decide you like the Stop, Target, Trailing Stop, and Risk:Reward components as-is, then just understanding how to plug in your Entry and Bullish / Bearish conditions (Triangles) and adjust the input texts to match your custom naming will be all you need to make it your own!
- If you want to adapt certain components, then this system gives you a great starting point to adapt your different concepts and ideas from.
▶️ SYSTEM COMPONENTS
- Each of the system's components are described via tooltips both in the input menu and in the tables' cells.
- Each label on the chart displays the corresponding price at those triggered conditions on hover with tooltips.
- The Trailing Stop only becomes active once it is above the Entry Price for that trade, and brightens to show it is active. The STOP line (right of price) moves once it takes over for the Entry Stop representing the level of the Trailing Stop at that time for that trade.
- The Lines / Labels to the right of price will brighten once price is above for Longs or below for Shorts. The Trade Tracking Table cells will add ☑️ once price is above for Longs or below for Shorts.
- The brighter boxes on the chart show the trades that occurred based on your criteria and are color coded for all components of each trade type to ensure your references are consistent. (Defaults are TV built-in strategies)
- The lighter boxes on the chart show the highest and lowest price levels reached during those trades, to highlight areas where improvements can be made or additional considerations can be accounted for by either adjusting Entry triggers or Bullish / Bearish triggers.
- Default Green and Red Triangles (Bullish / Bearish) default to having the same triggering condition as the Entry it corresponds to. This is to highlight either a pyramiding concept, early exit, or you can change to account for other things occurring during your trades which could help you with Stop and Target management/considerations.
TradingView and many of its community members have done a lot for me, so this is my attempt to give back.

Inverse MACD + DMI Scalping with Volatility Stop (By Coinrule)This script is focused on shorting during downtrends and utilises two strength based indicators to provide confluence that the start of a short-term downtrend has occurred - catching the opportunity as soon as possible.
This script can work well on coins you are planning to hodl for long-term and works especially well whilst using an automated bot that can execute your trades for you. It allows you to hedge your investment by allocating a % of your coins to trade with, whilst not risking your entire holding. This mitigates unrealised losses from hodling as it provides additional cash from the profits made. You can then choose to hodl this cash, or use it to reinvest when the market reaches attractive buying levels.
Alternatively, you can use this when trading contracts on futures markets where there is no need to already own the underlying asset prior to shorting it.
ENTRY
The trading system uses the Momentum Average Convergence Divergence (MACD) indicator and the Directional Movement Index (DMI) indicator to confirm when the best time is for selling. Combining these two indicators prevents trading during uptrends and reduces the likelihood of getting stuck in a market with low volatility.
The MACD is a trend following momentum indicator and provides identification of short-term trend direction. In this variation it utilises the 12-period as the fast and 26-period as the slow length EMAs, with signal smoothing set at 9.
The DMI indicates what way price is trending and compares prior lows and highs with two lines drawn between each - the positive directional movement line (+DI) and the negative directional movement line (-DI). The trend can be interpreted by comparing the two lines and what line is greater. When the negative DMI is greater than the positive DMI, there are more chances that the asset is trading in a sustained downtrend, and vice versa.
The system will enter trades when two conditions are met:
1) The MACD histogram turns bearish.
2) When the negative DMI is greater than the positive DMI.
EXIT
The strategy comes with a fixed take profit combined with a volatility stop, which acts as a trailing stop to adapt to the trend's strength. Depending on your long-term confidence in the asset, you can edit the fixed take profit to be more conservative or aggressive.
The position is closed when:
Take-Profit Exit: +8% price decrease from entry price.
OR
Stop-Loss Exit: Price crosses above the volatility stop.
In general, this approach suits medium to long term strategies. The backtesting for this strategy begins on 1 April 2022 to 18 July 2022 in order to demonstrate its results in a bear market. Back testing it further from the beginning of 2022 onwards further also produces good returns.
Pairs that produce very strong results include SOLUSDT on the 45m timeframe, MATICUSDT on the 2h timeframe, and AVAUSDT on the 1h timeframe. Generally, the back testing suggests that it works best on the 45m/1h timeframe across most pairs.
A trading fee of 0.1% is also taken into account and is aligned to the base fee applied on Binance.

Easy Scalping by JayKasunBINANCE:BTCUSDTPERP
This indicator can show stochastic RSI K and D line crosses and some candlestick patterns on chart.
You can use this indicator to scalping, check usage for more info. Always backtest before trading with your real money.
This indicator will also help mobile TradingView users to get an idea when getting stochastic RSI signals, they can use this indicator to check if stochastic RSI K and D crossed or not. ( Because they have limited area to view chart ) .
4 Exponential moving averages are there in the indicator with easy enable disable option. 9 , 21 , 55 , 100 is suggested as default values.
Meanings of signs in chart
Blue triangle bellow candle means it's a stochastic RSI K and D line cross in oversold level
Red triangle above candle means it's a stochastic RSI K and D line cross in overbought level
Green plus sign shows when EMA 50 crossover EMA 100
Red plus sign shows when EMA 50 cross bellow EMA 100
Features
You can enable candlestick pattern displaying when stochastic RSI K and D cross happen. Check indicator settings.
You can enable displaying ATR Trailing Stops in indicator settings.
Indicator will only show blue triangle after Green plus sign and Red triangles after Red plus sign
After you enable candlestick pattern option, stochastic RSI crosses with candlestick patterns will show in deferent colors. Blue triangle will turn into green and Red triangle into pink.
Usage
Use lower time frames like 5m or 15m
After green plus sign, if price retouched 21 EMA or 55 EMA and blue triangle appeared , you can enter a long position.
After red plus sign, if price retouched 21 EMA or 55 EMA and red triangle appeared , you can enter a short position.
Always wait for candle close . signs of chart can be changed when candle closing. ( Does repaint until candle close )
Use ATR trailing to get a stop loss price.
Use 1:1 or 1:0.5 Risk Reward ratio. Because it's scalping and lower time frame.
Use more indicators like RSI to get more confirmations ( like divergences ) before entering a trade. Its more reliable.
Candlestick Patterns Short names
H - Hammer
IH -Inverted Hammer
BE - Bullish Engulfing ( green triangle )
BE - Bearish Engulfing ( pink triangle )
BH - Bullish Harami ( green triangle )
BH - Bearish Harami ( pink triangle )
I have included ATR + Trailing Stops by SimpleCryptoLife and Candlestick Patterns Identified (updated 3/11/15) by repo32
this is a combination of multiple indicators
credit goes to original creators of above indicators

Joker Trailing TP BotTrailing Take Profit is used by the traders to increase their gains when the prices moves in a favorable direction. Let’s have a look at what is Trailing Take Profit and how it works.
What Is a Trailing Take Profit?
Trailing Take Profit is a term largely used in crypto, whereas you may encounter the term Trailing Stop in traditional trading describing almost the same thing, So what’s the difference between Trailing Take Profit and Trailing Stop? Trailing Stop is a type of Stop Loss automatically moving in the same direction as the asset’s price. Trailing Take Profit is nothing else than Trailing Stop activated after initial Take Profit is reached.
The main difference between these two is that Trailing Take Profit takes the profit in any case (altough it might be later annihilated by Trailing Stop). Thus, Trailing Take Profit reduces the risks that might’ve occurred using Trailing Stop alone. Trailing Take Profit is bound to the maximum of Take Profit price instead of just a price increase/decrease.
As you might notice, the terms Trailing Take Profit and Stop Loss are quite similar. To avoid confusion, in this article we will be talking about Trailing Take Profit as defined above.
Trailing Take Profit only moves in one direction. It is designed to lock in profit and limit losses. The trailing profit only moves up (in case of a long strategy) once the price has surpassed previous high and a new high has been established. If the trailing take profit moves up, it cannot move back down, thus securing the profit and preventing losses.
Trailing Take Profit allows the trade to remain open and continue to profit as long as the price is moving in the investor’s favor. If the price changes direction and the change surpasses the previously set percentage the order will be closed.
How Does it Work?
For example if you buy BTC at the price of 10000, if you set a Take Profit at 11000 and a Trailing Take Profit at 5% :
If the price goes up to 10500, nothing happens because the Take Profit at 11000 has not been reached.
Then if the BTC price goes up top 11000, a Stop Order at 10450 will be set.
Then if the BTC price goes down to 10500, the Stop Order stays at 104500.
Then if the BTC price goes up to 12000, the Stop Order moves to 11400.
Then if the BTC price goes down to 11000, the Stop Order at 11400 is executed.
You see that without Trailing Take Profit, the buy order would have been sold at 11000. Thus, a trader would miss an earning opportunity at 11400.

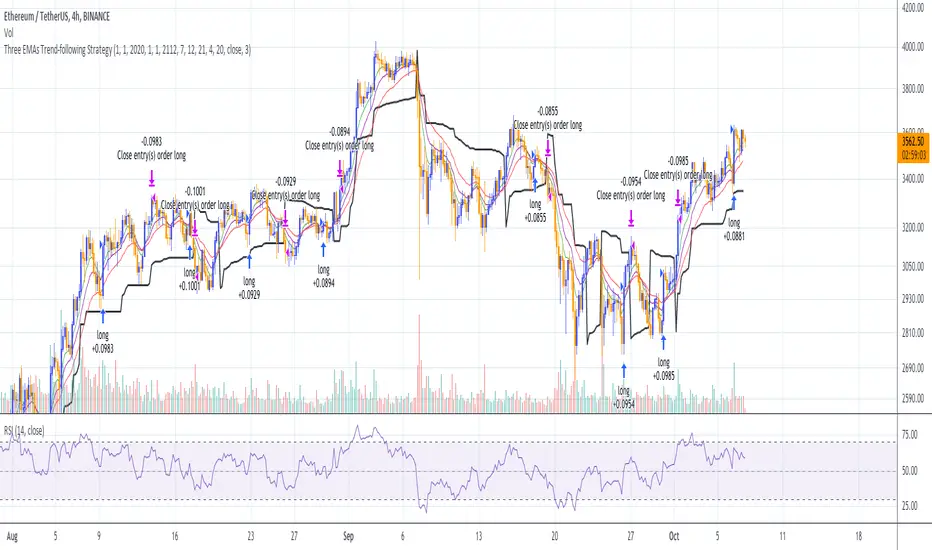
Three EMAs Trend-following Strategy (by Coinrule)Trend-following strategies are great because they give you the peace of mind that you're trading in line with the market.
However, by definition, you're always following. That means you're always a bit later than your want to be. The main challenges such strategies face are:
Confirming that there is a trend
Following the trend, hopefully, early enough to catch the majority of the move
Hopping off the trade when it seems to have run its course
This EMA Trend-following strategy attempts to address such challenges while allowing for a dynamic stop loss.
ENTRY
The trading system requires three crossovers on the same candle to confirm that a new trend is beginning:
Price crossing over EMA 7
Price crossing over EMA 14
Price crossing over EMA 21
The first benefit of using all three crossovers is to reduce false signals. The second benefit is that you know that a strong trend is likely to develop relatively soon, with the help of the fast setup of the three EMAs.
EXIT
The strategy comes with a fixed take profit and a volatility stop, which acts as a trailing stop to adapt to the trend's strength. That helps you get out of the way as soon as market conditions change. Depending on your long-term confidence in the asset, you can edit the fixed take profit to be more conservative or aggressive.
The position is closed when:
The price increases by 4%
The price crosses below the volatility stop.
The best time frame for this strategy based on our backtest is the 4-hr. Shorter timeframes can also work well, although they exhibit larger volatility in their returns. In general, this approach suits medium timeframes. A trading fee of 0.1% is taken into account. The fee is aligned to the base fee applied on Binance, which is the largest cryptocurrency exchange.

Template Trailing Strategy (Backtester)💭 Overview
+ Title: Template Trailing Strategy (Backtester)
+ Author: Iason Nikolas (jason5480)
+ License: CC BY-NC-SA 4.0
💢 What is the "Template Trailing Strategy (Backtester)" ❓
The "Template Trailing Strategy (Backtester)" (TTS) is a back-tester orchestration framework. It supercharges the implementation-test-evaluation lifecycle of new trading strategies, by making it possible to plug in your own trading idea.
While TTS offers a vast number of configuration settings, it primarily allows the trader to:
Test and evaluate your own trading logic that is described in terms of entry, exit, and cancellation conditions.
Define the entry and exit order types as well as their target prices when the limit, stop, or stop-limit order types are used.
Utilize a variety of options regarding the placement of the stop-loss and take-profit target(s) prices and support for well-known techniques like moving to breakeven and trailing.
Provide well-known quantity calculation methods to properly handle risk management and easily evaluate trading strategies and compare them.
Alert on each trading event or any related change through a robust and fully customizable messaging system.
All of the above makes TTS a practical toolkit: once you learn it, many repetitive tasks that strategy authors usually re-implement are eliminated. Using TradingView’s built-in backtesting engine makes testing and comparing ideas straightforward.
By utilizing the TTS one can easily swap "trading logic" by testing, evaluating, and comparing each trading idea and/or individual component of a strategy.
Finally, TTS, through its per-event alert management (and debugging) system, provides an automated solution that supports live trading with brokers via webhooks.
NOTE: The "Template Trailing Strategy (Backtester)" does not dictate how you can combine different indicator types. Thus, it should not be confused as a "Trading System", because it gives its user full flexibility on that end (for better or worse).
💢 What is a "Signal Indicator" ❓
"Signal Indicator" (SI) is an indicator that can output a "signal" that follows a specific convention so that the "Template Trailing Strategy (Backtester)" can "understand" and execute the orders accordingly. The SI realizes the core trading logic signaling to the TTS when to enter, exit, or cancel an order. A SI instructs the TTS "when" to enter or exit, and the TTS determines "how" to enter and exit the position once the Signal Indicator generates a signal.
A very simple example of a Signal Indicator might be a 200-day Simple Moving Average Signal. When the price of the security closes above the 200-day SMA, a SI would provide TTS with a "long entry signal". Once TTS receives the "long entry signal", the TTS will open a long position and send an alert or automated trade message via webhook to a broker, based on the Entry settings defined in TTS. If the TTS Entry settings specify a "Market" order type, then the open long position will be executed by TTS immediately. But if the TTS Entry settings specify a "Stop" order type with a 1% Stop Distance, then when the price of the security rises by 1% after the "long entry signal" occurs, the TTS will open a long position and the Long Entry alert or webhook to the broker will be sent.
🤔 How to Guide
💢 How to connect a "signal" from a "Signal Indicator" ❓
The "Template Trailing Strategy (Backtester)" was designed to receive external signals from a "Signal Indicator". In this way, a "new trading idea" can be developed, configured, and evaluated separately from the TTS. Similarly, the SI can be held constant, and the trading mechanics can change in the TTS settings and back-tested to answer questions such as, "Am I better with a different stop loss placement method, what if I used a limit order instead of a stop order to enter, what if I used 25% margin instead of trading spot market?"
To make that possible by connecting an external signal indicator to TTS, you should:
Add both your SI (e.g. "Two MA Signal Indicator" , "Click Signal Indicator" , "Signal Adapter" , "Signal Composer" ) and the TTS script to the same chart.
Open the script's Settings / Inputs dialog for the TTS.
In the 🛠️ STRATEGY group set 𝐃𝐞𝐚𝐥 𝐂𝐨𝐧𝐝𝐢𝐨𝐧𝐬 𝐌𝐨𝐝𝐞 to 🔨External (this makes TTS listen to an external signal source).
Still inside 🛠️ STRATEGY locate the 🔌𝐒𝐢𝐠𝐧𝐚𝐥 🛈 input and choose the plotted output of your SI. The option should look like: "<SI short title>:🔌Signal to TTS" .
Verbose troubleshooting & tips
If the SI does not appear in the 🔌Signal 🛈 selector, confirm both scripts are added to the same chart and the SI exposes a plotted series (title often "🔌Signal to TTS").
When using multiple SIs, pick the SI instance that actually outputs the "🔌Signal to TTS" plotted series.
Validate on the chart: when your SI changes state, the plotted "🔌Signal" series in the TTS (visible in the data window) should change accordingly.
The TTS accepts only signals that follow the tts_convention DealConditions structure. Do not attempt to feed arbitrary scalar series without using conv.getDealConditions / conv.DealConditions.
Make sure your SI composes a DealConditions value following the TTS convention (startLong, endLong, startShort, endShort — optional cancel fields). See the template below.
If the plot is present but TTS does not react, ensure the SI plot is non-repainting (or accept realtime/backtest limitations). Test on historical bars first.
Create alerts on the strategy (see the Alerts section). Use the {{strategy.order.alert_message}} placeholder in the Create Alert dialog to forward TTS messages.
💢 How to create a custom trading logic ❓
The "Template Trailing Strategy (Backtester)" provides two ways to plug in your custom trading logic. Both of them have their advantages and disadvantages.
✍️ Develop your own Customized "Signal Indicator" 💥
The first approach is meant to be used for relatively more complex trading logic. The advantages of this approach are the full control and customization you have over the trading logic and the relatively simple configuration setup by having two scripts only. The downsides are that you have to have some experience with pinescript or you are willing to learn and experiment. You should also know the exact formula for every indicator you will use since you have to write it by yourself. Copy-pasting from existing open-source indicators will get you started quite fast though.
The idea here is either to create a new indicator script from scratch or to copy an existing non-signal indicator and make it a "Signal Indicator". To create a new script, press the "Pine Editor" button below the chart to open the "Pine Editor" and then press the "Open" button to open the drop-down menu with the templates. Select the "New Indicator" option. Add it to your chart to copy an existing indicator and press the source code {} button. Its source code will be shown in the "Pine Editor" with a warning on top stating that this is a read-only script. Press the "create a working copy". Now you can give a descriptive title and a short title to your script, and you can work on (or copy-paste) the (other) indicators of your interest. Once you have the information needed to decide, define a DealConditions object and plot it like this:
import jason5480/tts_convention/ as conv
// Calculate the start, end, cancel start, cancel end conditions
dealConditions = conv.DealConditions.new(
startLongDeal = ,
startShortDeal = ,
endLongDeal = ,
endShortDeal = ,
cnlStartLongDeal = ,
cnlStartShortDeal = ,
cnlEndLongDeal = ,
cnlEndShortDeal = )
// Use this signal in scripts like "Template Trailing Strategy (Backtester)" and "Signal Composer" that can utilize its value
// Emit the current signal value according to the TTS framework convention
plot(series = conv.getSignal(dealConditions), title = '🔌Signal to TTS', color = #808000, editable = false, display = display.data_window + display.status_line, precision = 0)
You should import the latest version of the tts_convention library and write your deal conditions appropriately based on your trading logic and put them in the code section shown above by replacing the "…" part after "=". You can omit the conditions that are not relevant to your logic. For example, if you use only market orders for entering and exiting your positions the cnlStartLongDeal, cnlStartShortDeal, cnlEndLongDeal, and cnlEndShortDeal are irrelevant to your case and can be safely omitted from the DealConditions object. After successfully compiling your new custom SI script add it to the same chart with the TTS by pressing the "Add to chart" button. If all goes well, you will be able to connect your "signal" to the TTS as described in the "How to connect a "signal" from a "Signal Indicator"?" guide.
🧩 Adapt and Combine existing non-signal indicators 💥
The second approach is meant to be used for relatively simple trading logic. The advantages of this approach are the lack of pine script and coding experience needed and the fact that it can be used with closed-source indicators as long as the decision-making part is displayed as a line in the chart. The drawback is that you have to have a subscription that supports the "indicator on indicator" feature so you can connect the output of one indicator as an input to another indicator. Please check if your plan supports that feature here
To plug in your own logic that way you have to add your indicator(s) of preference in the chart and then add the "Signal Adapter" script in the same chart as well. This script is a "Signal Indicator" that can be used as a proxy to define your custom logic in the CONDITIONS group of the "Settings/Inputs" tab after defining your inputs from your preferred indicators in the VARIABLES group. Then a "signal" will be produced, if your logic is simple enough it can be directly connected to the TTS that is also added to the same chart for execution. Check the "How to connect a "signal" from a "Signal Indicator"?" in the "🤔 How to Guide" for more information.
If your logic is slightly more complicated, you can add a second "Signal Adapter" in your chart. Then you should add the "Signal Composer" in the same chart, go to the SIGNALS group of the "Settings/Inputs" tab, and connect the "signals" from the "Signal Adapters". "Signal Composer" is also a SI so its composed "signal" can be connected to the TTS the same way it is described in the "How to connect a "signal" from a "Signal Indicator"?" guide.
At this point, due to the composability of the framework, you can add an arbitrary number (bounded by your subscription of course) of "Signal Adapters" and "Signal Composers" before connecting the final "signal" to the TTS.
💢 How to set up ⏰Alerts ❓
The "Template Trailing Strategy (Backtester)" provides a fully customizable per-event alert mechanism. This means that you may have an entirely different message for entering and exiting into a position, hitting a stop-loss or a take-profit target, changing trailing targets, etc. There are no restrictions, and this gives you great flexibility.
First enable the events you want under the "🔔 ALERT MESSAGES" module. Each enabled event exposes a text area where you can craft the message using placeholders that TTS replaces with actual values when the event occurs.
The placeholder categories (exact names used by the script) are:
Chart & instrument:
{{ticker}}
{{base_currency}}
{{quote_currency}}
Entry / exit / stop / TP prices & offsets:
{{entry_price}}
{{exit_price}}
{{stop_loss_price}}
{{take_profit_price_1}} ... {{take_profit_price_5}}
{{entry+_price}}, {{entry-_price}}, {{exit+_price}}, {{exit-_price}} — Optional offset helpers (computed using "Offset Ticks")
Quantities, percents & derived quantities:
{{entry_base_quantity}} — base units at entry (e.g. BTC)
{{entry_quote_quantity}} — quote amount at entry (e.g. USD)
{{risk_perc}} — % of capital risked for that entry (multiplied by 100 when "Percentage Range " is enabled)
{{remaining_quantity_perc}} — % of the initial position remaining at close/SL
{{remaining_base_quantity}} — remaining base units at close/SL
{{take_profit_quantity_perc_1}} ... {{take_profit_quantity_perc_5}} — % sold/bought at each TP
{{take_profit_base_quantity_1}} ... {{take_profit_base_quantity_5}} — base units closed at each TP
❗ Important: the per-event alert text is injected into the Create Alert dialog using TradingView's strategy placeholder:
{{strategy.order.alert_message}}
During the creation of a strategy alert, make sure the placeholder {{strategy.order.alert_message}} exists in the "Message" box. TradingView will substitute the per-event text you configured and enabled in TTS Settings/Inputs before sending it via webhook/notification.
Tip: For webhook/broker execution, set the proper "Condition" in the Create Alert dialog (for changing-entry/exit/SL notifications use "Order fills and alert() function calls" or "alert() function calls only" as appropriate).
💢 How to execute my orders in a broker ❓
To execute your orders in a broker that supports webhook integration, you should enable the appropriate alerts in the "Template Trailing Strategy (Backtester)" first (see the "How to set up Alerts?" guide above). Then you should go to the "Create Alert/Notifications" tab check the "Webhook URL" and paste the URL provided by your broker. You have to read the documentation of your broker for more information on what messages are expected.
Keep in mind that some brokers have deep integration with TradingView so a per-event alert approach might be overkill.
📑 Definitions
This section tries to give some definitions in terms that appear in the "Settings/Inputs" tab of the "Template Trailing Strategy (Backtester)"
💢 What is Trailing ❓
Trailing is a technique where a price target follows another "barrier" price (usually high or low) by trying to keep a maximum distance from the "barrier" when it moves in only one direction (up or down). When the "barrier" moves in the other direction the price target will not change. There are as many types of trailing as price targets, which means that there are entry trailing, exit trailing, stop-loss trailing, and take-profit trailing techniques.
💢 What is a Moonbag ❓
A Moonbag in a trade is the quantity of the position that is reserved and will not be exited even if all take-profit targets defined in the strategy are hit, the quantity will be exited only if the stop-loss is hit or a close signal is received. This makes the stop-loss trailing technique in a trend-following strategy a good candidate to take advantage of a Moonbag.
💢 What is Distance ❓
Distance is the difference between two prices.
💢 What is Bias ❓
Bias is a psychological phenomenon where you make decisions based on market sentiment. For example, when you want to enter a long position you have a long bias, and when you want to exit from the long position you have a short bias. It is the other way around for the short position.
💢 What is the Bias Distance of a price target ❓
The Bias Distance of a price target is the distance that the target will deviate from its initial price. The direction of this deviation depends on the bias of the market. For example, suppose you are in a long position, and you set a take-profit target to the local highest high. In that case, adding a bias distance of five ticks will place your take-profit target 5 ticks below this local highest high because you have a short bias when exiting a long position. When the bias is long the bias distance will be added resulting in a higher target price and when you have a short bias the bias distance will be subtracted.
⚙️ Settings
In the "Settings/Inputs" tab of the "Template Trailing Strategy (Backtester)", you can find all the customizable settings that are provided by the framework. The variety of those settings is vast; hence we will only scratch the surface here. However, for every setting, there is an information icon 🛈 where you can learn more if you mouse over it. The "Settings/Inputs" tab is divided into ten main groups. Each one of them is responsible for one module of the framework. Every setting is part of a group that is named after the module it represents. So, to spot the module of a setting find the title that appears above it comes with an emoji and uppercase letters. Some settings might have the same name but belong to different modules e.g. "Tgt Dist Mtd" (Target Distance Method). Some settings are indented, which means that they are closely related to the non-indented setting above. Usually, indented settings provide further configuration for one or more options of the non-indented setting above. The groups that correspond to each module of the framework are the following:
🗺️ Quick Module Cross-Reference (use emojis to jump to setting groups)
📆 FILTERS — session, date & weekday filters
🛠️ STRATEGY — internal vs external deal-conditions; pick the signal source
🔧 STRATEGY – INTERNAL — built-in Two MA logic for demonstration purposes
🎢 VOLATILITY — ATR / StDev update modes
🔷 ENTRY — entry order types & trailing
🎯 TAKE PROFIT — multi-step TP and trailing rules
🛑 STOP LOSS — stop placement, move-to-breakeven, trailing
🟪 EXIT — exit order types & cancel logic
💰 QUANTITY/RISK MANAGEMENT — position sizing, moonbag, limits
📊 ANALYTICS — stats, streaks, seasonal tables
🔔 ALERT MESSAGES — per-event alert templates & placeholders
😲 Caveats
💢 Does "Template Trailing Strategy (Backtester)" have repainting behavior? ❓
The answer is that the "Template Trailing Strategy (Backtester)" does not repaint as long as the "Signal Indicator" that is connected also does not repaint. If you developed your own SI make sure that you understand and know how to prevent this behavior. The publication by @PineCoders here will give you a good idea on how to avoid most of the repainting cases.
⚠️ There is an exception though, when the "Enable Trail⚠️💹" checkbox is checked, the Take Profit trailing feature is enabled, and a tick-based approach is used, meaning that after a while, when the TradingView discards all the real-time data, assumptions will be made by the backtesting engine that will cause a form of repainting. To avoid making false assumptions please disable this feature in the early stages and evaluate its usefulness in your strategy later on, after first confirming the success of the logic without this feature. In this case, consider turning on the bar magnifier feature. This way you will get more accurate backtest results when the Take Profit trailing feature is enabled.
💢 Can "Template Trailing Strategy (Backtester)" satisfy all my trading strategies ❓
While this framework can satisfy quite a large number of trading strategies there are cases where it cannot do so. For example, if you have a custom logic for your stop-loss or take-profit placement, or if you want to dollar cost average, then it might be better to start a new strategy script from scratch.
⚠️ It is not recommended to copy the official TTS code and start developing unless you are a Pine wizard! Even in that case, there is a stiff learning curve that might not be worth your time. Last, you must consider that I do not offer support for customized versions of the TTS script and if something goes wrong in the process you are all alone.
💝 Support & Feedback
For feedback, bug reports, or feature requests, contact me via TradingView PM or use the script comments.
Note: The author's personal links and contact are available on the TradingView profile.
🤗 Thanks
Special thanks to the welcoming community members, who regularly gave feedback all those years and helped me to shape the framework as it is today! Thanks everyone who contributed by either filing a "defect report" or asking questions that helped me to understand what improvements were necessary to help traders.
Enjoy!
Jason

Three EMAs Trend-following Strategy (by Coinrule)Trend-following strategies are great because they give you the peace of mind that you're trading in line with the market.
However, by definition, you're always following . That means you're always a bit later than your want to be. The main challenges such strategies face are:
Confirming that there is a trend
Following the trend, hopefully, early enough to catch the majority of the move
Hopping off the trade when it seems to have run its course
This EMA Trend-following strategy attempts to address such challenges while allowing for a dynamic stop loss.
ENTRY
The trading system requires three crossovers on the same candle to confirm that a new trend is beginning:
Price crossing over EMA 7
Price crossing over EMA 14
Price crossing over EMA 21
The first benefit of using all three crossovers is to reduce false signals. The second benefit is that you know that a strong trend is likely to develop relatively soon, with the help of the fast setup of the three EMAs.
EXIT
The strategy comes with a fixed take profit and a volatility stop, which acts as a trailing stop to adapt to the trend's strength. That helps you get out of the way as soon as market conditions change. Depending on your long term confidence in the asset, you can edit the fixed take profit to be more conservative or aggressive.
The position is closed when:
The price increases by 4%
The price crosses below the volatility stop.
The best time frame for this strategy based on our backtest is the 4-hr. Shorter timeframes can also work well, although they exhibit larger volatility in their returns. In general, this approach suits medium timeframes. A trading fee of 0.1% is taken into account. The fee is aligned to the base fee applied on Binance, which is the largest cryptocurrency exchange.
You can execute this strategy on your favourite exchange at coinrule.com
Risk Management Tool [LuxAlgo]Good money management is one of the fundamental pillars of successful trading. With this indicator, we propose a simple way to manage trading positions. This tool shows Profit & Loss (P&L), suggests position size given a certain risk, sets stop losses and take profit levels using fixed price value/percentage/ATR/Range, and can also determine entries from crosses with technical indicators which is particularly handy if you don't want to set an entry manually.
1. Settings
Position Type: Determines if the position should be a "Long" or "Short".
Account Size: Determines the total capital of the trading account.
Risk: The maximum risk amount for a trade. Can be set as a percentage of the account size or as a fixed amount.
Entry Price: Determines the entry price of the position.
Entry From Cross: When enabled, allows to set the entry price where a cross with an external source was produced.
1.1 Stop Loss/Take Profit
Take Profit: Determines the take profit level, which can be determined by a value or percentage.
Stop Loss: Determines the stop loss level, which can be determined by a value or percentage.
2. Usage
One of the main usages of position management tools is to determine the position size to allocate given a specific risk amount and stop-loss. 2% of your capital is often recommended as a risk amount.
Our tool allows setting stop losses and take profits with different methods.
The ATR method sets the stop loss/take profit one ATR away from the entry price, with the ATR period being determined in the drop-down menu next to the selected methods. The range method works similarly but instead of using the ATR, we use a rolling range with a period determined in the drop-down menu next to the selected methods as well.
Unlike the available position management tool on TradingView, the entry can be determined from a cross between the price an an external source. The image above shows entries from the Volatility Stop indicator. This is particularly useful if you set positions based on trailing stops.

MACD + DMI Scalping with Volatility Stop by (Coinrule)Trend-following strategies are cool because they allow you to catch potential high returns.
The main limit of such strategies are:
False signals > the asset is not experiencing a strong trend. The strategy gets stuck with a sideways move or, worst, with the beginning of a downtrend.
The sell signal may come later than the actual top, leading in some cases to turn a trade in profit into a loss.
This strategy tries to address these limitations to develop a trading system that optimises the entry and closes trade once the profit achieves a pre-set level.
ENTRY
The trading system uses the MACD and the DMI to confirm when is the best time for buying. Combining these two indicators prevents trading during downtrends and reduces the likelihood of getting stuck in a market with low volatility.
The system confirms the entry when:
The MACD histogram turns bullish.
When the positive DMI is greater than the negative DMI, there are more chances that the asset is trading in a sustained uptrend.
EXIT
The strategy comes with a fixed take profit combined with a volatility stop, which acts as a trailing stop to adapt to the trend's strength. Depending on your long term confidence in the asset, you can edit the fixed take profit to be more conservative or aggressive.
The position is closed when:
The price increases by 3%
The price crosses below the volatility stop.
The best time frame for this strategy based on our backtest is the 3-hr . The 4-hr can work well. In general, this approach suits medium to long term strategies
The strategy assumes each order to trade 30% of the available capital to make the results more realistic. A trading fee of 0.1% is taken into account. The fee is aligned to the base fee applied on Binance, which is the largest cryptocurrency exchange.

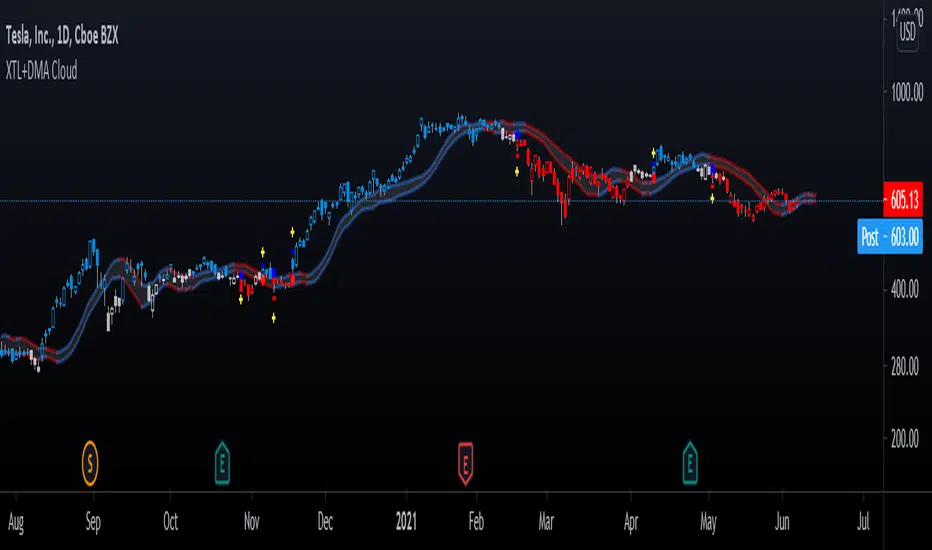
Advanced GET: Tom Joseph's XTL, DMA Cloud & Breakout SignalsThe Expert Trend Locator ( XTL ) was developed by Tom Joseph to identify major trends, similar to elliott wave 3 type swings.
Blue bars are bullish and indicate a potential upwards impulse.
Red bars are bearish and indicate a potential downwards impulse.
White bars indicate no trend is detected at the moment.
Added to the indicator is the recommended use to enter a position, as explained by Tom Joseph in his book Applying Technical Analysis:
Once a blue or red bar appears, the indicator signals an entry level, a stop loss level and two target levels (2nd is optional).
The levels can be shown until a new signal emerges or just above/below the breakout bar.
Finally, a cloud formed by two displaced moving averages (DMA) is included, which allow the trend to continue its momentum. During an uptrend the lower moving average could serve as a trailing stop, and during a downtrend the upper moving average could serve as the trailing stop.
Enjoy!
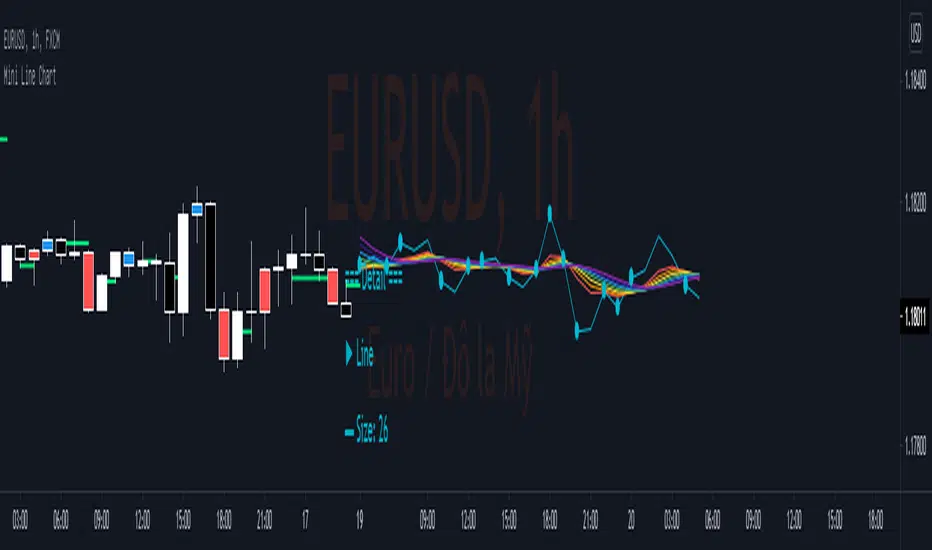
Mini Line ChartMini Line Chart show a small line chart beside the main chart. Detail of Mini Line chart as below:
1.Line chart adjustable:
- Size: number of bar to show as line chart
- Source: Open/ High/ Low/ Close/ HL2/ HLC3/ OHLC4
- Color
2.Rainbow Moving average adjustable:
- Type: SMA/EMA
- Period: Period of 1st MA
- Source: Open/ High/ Low/ Close/ HL2/ HLC3/ OHLC4
- Displacement: Period of moving avarage for 2nd MA to 7th MA
- 7 Color
3.Key Level
- Key Level is Line value when Line crossed Rainbow Moving Average
- Direction Up when Line cross over Rainbow Moving Average
- Direction Down when Line cross under Rainbow Moving Average
- Direction Not Defined when Line cross inside Rainbow Moving Average
4.Key Line
- Key Line ploted by Key Level at the main chart
- Width and color of Key Line adjutable.
5.Key Bar
- Key Bar is the Time when Line crossed Rainbow Moving Average
- Key Bar Up when Line cross over Rainbow Moving Average
- Key Bar Down when Line cross under Rainbow Moving Average
- Color of Key Bar Up and Down adjutable
6.Detail Panel
- Background color & Style of Label adjutable
- Size & color of Text adjutable
- Location of Label adjutable by X offset & Y offset
7.Alert
- Alert will send "Key Level" to email or app when Line and Rainbow make a new cross.
8.Trading
- Consider to open position when Price pullback near to "Key Line" then breakout "Key Bar"
- Consider to stay out when Price pullback to "Key Line" then breakout "Key Line".
- Consider to close position or trailing stoploss when Line and Rainbow make a new cross.
- Stoploss, Stop Order may be place at High or Low of Key Bar.
- Take profit may be place at nearest Key Line in the past
- Trailing Stop may be move with Key Line.
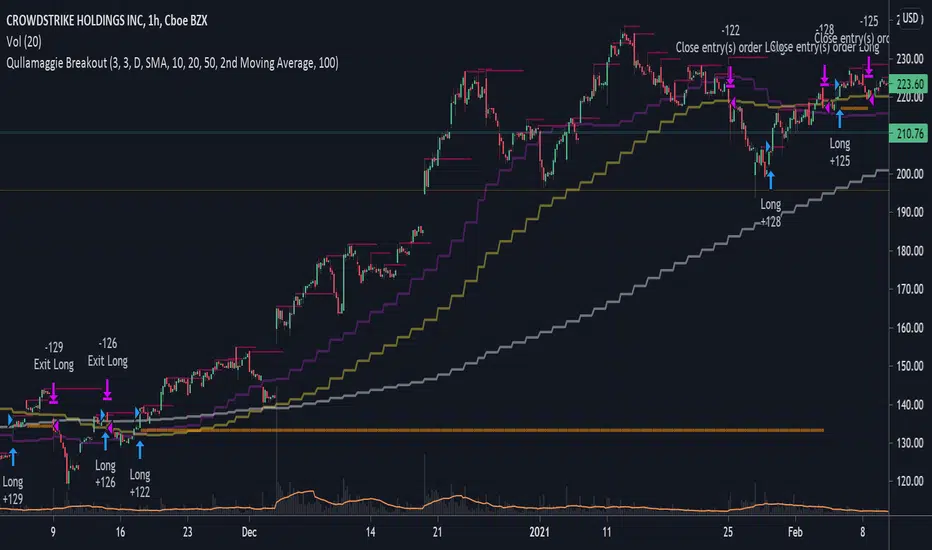
Qullamaggie BreakoutThe intent of this strategy is to buy breakouts with a tight stop on smaller timeframes in the direction of the longer term trend. Default longer term trend is the daily, but the user can choose any timeframe to use for the SMAs (which act as filters and trailing stops).
Exit the trade using a trailing stop of a close below either the 10 MA or 20 MA (user choice) on that larger timeframe as the position moves in your favor (i.e. whenever position price rises above the MA). This is one area where this script could use a little work or some human intervention - when the trade is entered right in the vicinity of the moving averages, you get some whipsaw. Not sure how to avoid that at this point though if you want to look at those longer term moving averages as your exit criteria.
Option of using daily ATR as a measure of finding contracting ranges and ensuring a decent risk/reward. (If the difference between the breakout point and your stop level is below a certain % of ATR, it could possibly find those consolidating periods.)
Bollinger Bands strategy with RSI and MACD v1.0 This is a strategy based on the Bollinger Bands, where buy trades are made when the price crosses the lower line of the Bollinger Bands upwards, and sell trades are made when the price crosses the upper line downwards.
In addition, it is possible through the inputs to enable trading with RSI and MACD, so that buy or sell trades are supported by these two indicators.
Trades are partially and fully closed in the following way, a buy trade will close half of the position when the price touches the middle line of the Bollinger bands and will be fully closed when the price touches the upper band. In the case of a sell position, half of the position will be closed if the price touches the middle band and the entire position will be closed when the price touches the lower band. Alternatively, a fixed take profit can be placed. In case the price moves against us, trailing stops can be placed.
In case of selecting to use RSI, MACD, or MACD variation, trades will be executed as long as The Bollinger Bands, and all the above-mentioned indicators give the same signals, either buy or sell.
For example in the case of selecting only Use RSI, buy trades would be made as long as RSI and BB give buy signals.
Strategy inputs:
-BB source: Bollinger Bands price source.
-Bollinger Bands SMA length: Bollinger Bands simple moving average length.
-Bollinger Bands StdDev length: Bollinger Bands standard deviation length.
-Trail Long Loss (%): Distance in percentage at which the stop loss will initially be placed for buy trades.
-Trail Short Loss (%): Distance in percentage at which the stop loss will be initially placed for sell trades.
-Maximum orders: Maximum of simultaneous operations, for example, if it is 3, up to 3 parallel operations of buy and up to 3 parallel operations of sell will be carried out.
-Position size: Number of contracts per trade.
-Use RSI: If selected, the strategy will also trade based on oversold or overbought signals provided by the RSI.
-RSI source: RSI price source.
-RSI period: The RSI period to use.
-RSI value for buy: If the RSI is below this value, it will give a buy signal.
-RSI value for sell: If the RSI value is above this value, it will give a sell signal.
-Use MACD: If selected, buy trades will be made when the MACD crosses 0 upwards, and sell trades will be made when the MACD crosses 0 downwards.
-Use MACD variation: Only available if MACD is previously selected. In this case, buy trades are made if the MACD value in the last 3 candles has been decreasing, and sell trades are made if the MACD value has been increasing.
-MACD source: MACD price source.
-MACD fast length: MACD fast EMA lenght.
-MACD slow length: MACD slow EMA lenght.
-MACD signal length: MACD signal EMA lenght.
-Use maximum TP long: If selected, a fixed take profit will be placed for buy trades. The position could be closed before reaching this take profit if the price touches one of the lower or upper lines first.
-Maximum take profit long (%): Distance in percentage at which the take profit will be placed for buy trades.
-Use maximum TP short: if selected, a fixed take profit will be placed for sell trades. The position could be closed before reaching this take profit if the price touches one of the lower or upper lines first.
-Maximum take profit short (%): Distance in percentage at which the take profit will be set for sell trades.
I hope you like it and as always all feedback is welcome.

KAMA Strategy - Kaufman's Adaptive Moving AverageThis strategy combines Kaufman's Adaptive Moving Average for entry with optional KAMA, PSAR, and Trailing ATR stops for exits.
Kaufman's Adaptive Moving Average is, in my opinion, a gem among the plethora of indicators. It is underrated considering it offers a solution that intuitively makes a lot of sense. When I first read about it, it was a real 'aha!' moment. Look at the top, pink line. Notice how during trending times it follows the trend quickly and closely, but during choppy, non-trending periods, the KAMA stays absolutely flat? Interesting! To trade with it, we simply follow the direction the KAMA is pointing. Is it up? Go long. Is it down? Go short. Is it flat? Hold on.
How does it manage to quickly follow real trends like a fast EMA but ignore choppy conditions that would whipsaw a fast EMA back and forth? It analyses whether recent price moves are significant relative to recent noise and then adapts the length of the EMA window accordingly. If price movement is big compared to the recent noise, the EMA window gets smaller. If price movement is relatively small or average compared to the recent noise, the EMA window gets bigger. In practice it means:
The KAMA would be flat if a 20 point upwards move occurred during a period that has had, on average, regular 20 point moves BUT
the KAMA would point up if a 20 point move occurred during a period that has, on average, had moves of only around 5 points.
In other words, it's a slow EMA during choppy flat / quiet flat periods, and a fast EMA as soon as significant volatility occurs. Perfect!
-----
The Strategy
The strategy is more than just a KAMA indicator. It contains:
KAMA exit (optional)
ATR trailing stop loss exit (optional)
PSAR stop loss exit (optional)
KAMA filter for entry and exits
All features are adjustable in the strategy settings
The Technical Details:
Check out the strategy's 'Inputs' panel. The buy and sell signals are based on the 'KAMA 1' there.
KAMA 1: Length -- 14 is the default. This is the length of the window the KAMA looks back over. In this instance, it c
KAMA 1: Fast KAMA Length -- 2 is the default. This is the tightest the EMA length is allowed to get. It will tend towards this length when volatility is high.
KAMA 1: Slow KAMA Length -- 20 is the default. This is the biggest the EMA length is allowed to get. It will tend towards this length when volatility is low.
KAMA Filter
The strategy buys when the KAMA begins to point up and sells when the KAMA points down. Generally, the KAMA is very good at filtering out the noise itself - it will go flat during noisy/choppy periods. But to add another layer of safety, its author, Perry Kaufman, proposed a KAMA filter. It works by taking the standard deviation of returns over the length of the the 'KAMA 1: Length' I mentioned above and multiplying it by an 'Entry Filter' (1 by default) and 'Exit Filter' (0.5 by default). The entry condition to go long is that the KAMA is pointing up and and it moved up more than 1 x St. Dev. of Returns. The exit condition is when the KAMA is pointing down and it moved down by more than 0.5 x St. Dev. of Returns.
Thanks
Thanks to ChuckBanger, cheatcountry, millerrh, and racer8 for parts of the code. I was able to build upon their good work.
-----
I hope this strategy is helpful to you.
Do you have any thoughts, ideas, or questions? Let me know in the comments or send me a message! I'd be glad to help you out.
If you need an indicator or strategy to be built or customised for you, let me know! I'll be glad to help and it'll probably be cheaper than you think!

MACD Strategy with trailing ATR stopThis is a trend based strategy that uses EMA and SMA intersection for determining the direction of the trend and MACD for the entry signal. At the same time, the strategy uses ATR, which is working as a trailing stop.
The strategy entry will work when the Trend ribbon will turn green and MACD line will crossover the signal line. This strategy also takes into account the pyramiding and allows to enter the second time if the signal will repeat itself.
There are 3 exit points. The first 10% of the position will be closed when the price will increase by 1%. The second portion of 50% will be closed when the price reaches 5% Take profit target. The remaining 40 % of the position will wait for the exit signal which will occur when the price closes below the ATR line.
The strategy is using a fixed amount in dollars, each time the entry occurs the strategy will enter with 100$ in the order.
The strategy can be applied to other crypto assets. However, they will require input changes.
Best of luck with your trading.

888 BOT #alerts█ 888 BOT #alerts (open source)
This is an Expert Advisor 'EA' or Automated trading script for ‘longs’ and ‘shorts’, which uses only a Take Profit or, in the worst case, a Stop Loss to close the trade.
It's a much improved version of the previous ‘Repanocha’. It doesn`t use 'Trailing Stop' or 'security ()' functions (although using a security function doesn`t mean that the script repaints) and all signals are confirmed, therefore the script doesn`t repaint in alert mode and is accurate in backtest mode.
Apart from the previous indicators, some more and other functions have been added for Stop-Loss, re-entry and leverage.
It uses 8 indicators, (many of you already know what they are, but in case there is someone new), these are the following:
1. Jurik Moving Average
It's a moving average created by Mark Jurik for professionals which eliminates the 'lag' or delay of the signal. It's better than other moving averages like EMA , DEMA , AMA or T3.
There are two ways to decrease noise using JMA . Increasing the 'LENGTH' parameter will cause JMA to move more slowly and therefore reduce noise at the expense of adding 'lag'
The 'JMA LENGTH', 'PHASE' and 'POWER' parameters offer a way to select the optimal balance between 'lag' and over boost.
Green: Bullish , Red: Bearish .
2. Range filter
Created by Donovan Wall, its function is to filter or eliminate noise and to better determine the price trend in the short term.
First, a uniform average price range 'SAMPLING PERIOD' is calculated for the filter base and multiplied by a specific quantity 'RANGE MULTIPLIER'.
The filter is then calculated by adjusting price movements that do not exceed the specified range.
Finally, the target ranges are plotted to show the prices that will trigger the filter movement.
Green: Bullish , Red: Bearish .
3. Average Directional Index ( ADX Classic) and ( ADX Masanakamura)
It's an indicator designed by Welles Wilder to measure the strength and direction of the market trend. The price movement is strong when the ADX has a positive slope and is above a certain minimum level 'ADX THRESHOLD' and for a given period 'ADX LENGTH'.
The green color of the bars indicates that the trend is bullish and that the ADX is above the level established by the threshold.
The red color of the bars indicates that the trend is down and that the ADX is above the threshold level.
The orange color of the bars indicates that the price is not strong and will surely lateralize.
You can choose between the classic option and the one created by a certain 'Masanakamura'. The main difference between the two is that in the first it uses RMA () and in the second SMA () in its calculation.
4. Parabolic SAR
This indicator, also created by Welles Wilder, places points that help define a trend. The Parabolic SAR can follow the price above or below, the peculiarity that it offers is that when the price touches the indicator, it jumps to the other side of the price (if the Parabolic SAR was below the price it jumps up and vice versa) to a distance predetermined by the indicator. At this time the indicator continues to follow the price, reducing the distance with each candle until it is finally touched again by the price and the process starts again. This procedure explains the name of the indicator: the Parabolic SAR follows the price generating a characteristic parabolic shape, when the price touches it, stops and turns ( SAR is the acronym for 'stop and reverse'), giving rise to a new cycle. When the points are below the price, the trend is up, while the points above the price indicate a downward trend.
5. RSI with Volume
This indicator was created by LazyBear from the popular RSI .
The RSI is an oscillator-type indicator used in technical analysis and also created by Welles Wilder that shows the strength of the price by comparing individual movements up or down in successive closing prices.
LazyBear added a volume parameter that makes it more accurate to the market movement.
A good way to use RSI is by considering the 50 'RSI CENTER LINE' centerline. When the oscillator is above, the trend is bullish and when it is below, the trend is bearish .
6. Moving Average Convergence Divergence ( MACD ) and ( MAC-Z )
It was created by Gerald Appel. Subsequently, the histogram was added to anticipate the crossing of MA. Broadly speaking, we can say that the MACD is an oscillator consisting of two moving averages that rotate around the zero line. The MACD line is the difference between a short moving average 'MACD FAST MA LENGTH' and a long moving average 'MACD SLOW MA LENGTH'. It's an indicator that allows us to have a reference on the trend of the asset on which it is operating, thus generating market entry and exit signals.
We can talk about a bull market when the MACD histogram is above the zero line, along with the signal line, while we are talking about a bear market when the MACD histogram is below the zero line.
There is the option of using the MAC-Z indicator created by LazyBear, which according to its author is more effective, by using the parameter VWAP ( volume weighted average price ) 'Z-VWAP LENGTH' together with a standard deviation 'STDEV LENGTH' in its calculation.
7. Volume Condition
Volume indicates the number of participants in this war between bulls and bears, the more volume the more likely the price will move in favor of the trend. A low trading volume indicates a lower number of participants and interest in the instrument in question. Low volumes may reveal weakness behind a price movement.
With this condition, those signals whose volume is less than the volume SMA for a period 'SMA VOLUME LENGTH' multiplied by a factor 'VOLUME FACTOR' are filtered. In addition, it determines the leverage used, the more volume , the more participants, the more probability that the price will move in our favor, that is, we can use more leverage. The leverage in this script is determined by how many times the volume is above the SMA line.
The maximum leverage is 8.
8. Bollinger Bands
This indicator was created by John Bollinger and consists of three bands that are drawn superimposed on the price evolution graph.
The central band is a moving average, normally a simple moving average calculated with 20 periods is used. ('BB LENGTH' Number of periods of the moving average)
The upper band is calculated by adding the value of the simple moving average X times the standard deviation of the moving average. ('BB MULTIPLIER' Number of times the standard deviation of the moving average)
The lower band is calculated by subtracting the simple moving average X times the standard deviation of the moving average.
the band between the upper and lower bands contains, statistically, almost 90% of the possible price variations, which means that any movement of the price outside the bands has special relevance.
In practical terms, Bollinger bands behave as if they were an elastic band so that, if the price touches them, it has a high probability of bouncing.
Sometimes, after the entry order is filled, the price is returned to the opposite side. If price touch the Bollinger band in the same previous conditions, another order is filled in the same direction of the position to improve the average entry price, (% MINIMUM BETTER PRICE ': Minimum price for the re-entry to be executed and that is better than the price of the previous position in a given %) in this way we give the trade a chance that the Take Profit is executed before. The downside is that the position is doubled in size. 'ACTIVATE DIVIDE TP': Divide the size of the TP in half. More probability of the trade closing but less profit.
█ STOP LOSS and RISK MANAGEMENT.
A good risk management is what can make your equity go up or be liquidated.
The % risk is the percentage of our capital that we are willing to lose by operation. This is recommended to be between 1-5%.
% Risk: (% Stop Loss x % Equity per trade x Leverage) / 100
First the strategy is calculated with Stop Loss, then the risk per operation is determined and from there, the amount per operation is calculated and not vice versa.
In this script you can use a normal Stop Loss or one according to the ATR. Also activate the option to trigger it earlier if the risk percentage is reached. '% RISK ALLOWED' wich is calculated according with: '%EQUITY ON EACH ENTRY'. Only works with Stop Loss on 'NORMAL' or 'BOTH' mode.
'STOP LOSS CONFIRMED': The Stop Loss is only activated if the closing of the previous bar is in the loss limit condition. It's useful to prevent the SL from triggering when they do a ‘pump’ to sweep Stops and then return the price to the previous state.
█ ALERTS
There is an alert for each leverage, therefore a maximum of 8 alerts can be set for 'long' and 8 for 'short', plus an alert to close the trade with Take Profit or Stop Loss in market mode. You can also place Take Profit limit and Stop Loss limit orders a few seconds after filling the position entry order.
- 'MAXIMUM LEVERAGE': It is the maximum allowed multiplier of the % quantity entered on each entry for 1X according to the volume condition.
- 'ADVANCE ALERTS': There is always a time delay from when the alert is triggered until it reaches the exchange and can be between 1-15 seconds. With this parameter, you can advance the alert by the necessary seconds to activate it earlier. In this way it can be synchronized with the exchange so that the execution time of the entry order to the position coincides with the opening of the bar.
The settings are for Bitcoin at Binance Futures (BTC: USDTPERP) in 15 minutes.
For other pairs and other timeframes, the settings have to be adjusted again. And within a month, the settings will be different because we all know the market and the trend are changing.

888 BOT #backtest█ 888 BOT #backtest (open source)
This is an Expert Advisor 'EA' or Automated trading script for ‘longs’ and ‘shorts’, which uses only a Take Profit or, in the worst case, a Stop Loss to close the trade.
It's a much improved version of the previous ‘Repanocha’. It doesn`t use 'Trailing Stop' or 'security()' functions (although using a security function doesn`t mean that the script repaints) and all signals are confirmed, therefore the script doesn`t repaint in alert mode and is accurate in backtest mode.
Apart from the previous indicators, some more and other functions have been added for Stop-Loss, re-entry and leverage.
It uses 8 indicators, (many of you already know what they are, but in case there is someone new), these are the following:
1. Jurik Moving Average
It's a moving average created by Mark Jurik for professionals which eliminates the 'lag' or delay of the signal. It's better than other moving averages like EMA , DEMA , AMA or T3.
There are two ways to decrease noise using JMA . Increasing the 'LENGTH' parameter will cause JMA to move more slowly and therefore reduce noise at the expense of adding 'lag'
The 'JMA LENGTH', 'PHASE' and 'POWER' parameters offer a way to select the optimal balance between 'lag' and over boost.
Green: Bullish , Red: Bearish .
2. Range filter
Created by Donovan Wall, its function is to filter or eliminate noise and to better determine the price trend in the short term.
First, a uniform average price range 'SAMPLING PERIOD' is calculated for the filter base and multiplied by a specific quantity 'RANGE MULTIPLIER'.
The filter is then calculated by adjusting price movements that do not exceed the specified range.
Finally, the target ranges are plotted to show the prices that will trigger the filter movement.
Green: Bullish , Red: Bearish .
3. Average Directional Index ( ADX Classic) and ( ADX Masanakamura)
It's an indicator designed by Welles Wilder to measure the strength and direction of the market trend. The price movement is strong when the ADX has a positive slope and is above a certain minimum level 'ADX THRESHOLD' and for a given period 'ADX LENGTH'.
The green color of the bars indicates that the trend is bullish and that the ADX is above the level established by the threshold.
The red color of the bars indicates that the trend is down and that the ADX is above the threshold level.
The orange color of the bars indicates that the price is not strong and will surely lateralize.
You can choose between the classic option and the one created by a certain 'Masanakamura'. The main difference between the two is that in the first it uses RMA () and in the second SMA () in its calculation.
4. Parabolic SAR
This indicator, also created by Welles Wilder, places points that help define a trend. The Parabolic SAR can follow the price above or below, the peculiarity that it offers is that when the price touches the indicator, it jumps to the other side of the price (if the Parabolic SAR was below the price it jumps up and vice versa) to a distance predetermined by the indicator. At this time the indicator continues to follow the price, reducing the distance with each candle until it is finally touched again by the price and the process starts again. This procedure explains the name of the indicator: the Parabolic SAR follows the price generating a characteristic parabolic shape, when the price touches it, stops and turns ( SAR is the acronym for 'stop and reverse'), giving rise to a new cycle. When the points are below the price, the trend is up, while the points above the price indicate a downward trend.
5. RSI with Volume
This indicator was created by LazyBear from the popular RSI .
The RSI is an oscillator-type indicator used in technical analysis and also created by Welles Wilder that shows the strength of the price by comparing individual movements up or down in successive closing prices.
LazyBear added a volume parameter that makes it more accurate to the market movement.
A good way to use RSI is by considering the 50 'RSI CENTER LINE' centerline. When the oscillator is above, the trend is bullish and when it is below, the trend is bearish .
6. Moving Average Convergence Divergence ( MACD ) and ( MAC-Z )
It was created by Gerald Appel. Subsequently, the histogram was added to anticipate the crossing of MA. Broadly speaking, we can say that the MACD is an oscillator consisting of two moving averages that rotate around the zero line. The MACD line is the difference between a short moving average 'MACD FAST MA LENGTH' and a long moving average 'MACD SLOW MA LENGTH'. It's an indicator that allows us to have a reference on the trend of the asset on which it is operating, thus generating market entry and exit signals.
We can talk about a bull market when the MACD histogram is above the zero line, along with the signal line, while we are talking about a bear market when the MACD histogram is below the zero line.
There is the option of using the MAC-Z indicator created by LazyBear, which according to its author is more effective, by using the parameter VWAP ( volume weighted average price ) 'Z-VWAP LENGTH' together with a standard deviation 'STDEV LENGTH' in its calculation.
7. Volume Condition
Volume indicates the number of participants in this war between bulls and bears, the more volume the more likely the price will move in favor of the trend. A low trading volume indicates a lower number of participants and interest in the instrument in question. Low volumes may reveal weakness behind a price movement.
With this condition, those signals whose volume is less than the volume SMA for a period 'SMA VOLUME LENGTH' multiplied by a factor 'VOLUME FACTOR' are filtered. In addition, it determines the leverage used, the more volume , the more participants, the more probability that the price will move in our favor, that is, we can use more leverage. The leverage in this script is determined by how many times the volume is above the SMA line.
The maximum leverage is 8.
8. Bollinger Bands
This indicator was created by John Bollinger and consists of three bands that are drawn superimposed on the price evolution graph.
The central band is a moving average, normally a simple moving average calculated with 20 periods is used. ('BB LENGTH' Number of periods of the moving average)
The upper band is calculated by adding the value of the simple moving average X times the standard deviation of the moving average. ('BB MULTIPLIER' Number of times the standard deviation of the moving average)
The lower band is calculated by subtracting the simple moving average X times the standard deviation of the moving average.
the band between the upper and lower bands contains, statistically, almost 90% of the possible price variations, which means that any movement of the price outside the bands has special relevance.
In practical terms, Bollinger bands behave as if they were an elastic band so that, if the price touches them, it has a high probability of bouncing.
Sometimes, after the entry order is filled, the price is returned to the opposite side. If price touch the Bollinger band in the same previous conditions, another order is filled in the same direction of the position to improve the average entry price, (% MINIMUM BETTER PRICE ': Minimum price for the re-entry to be executed and that is better than the price of the previous position in a given %) in this way we give the trade a chance that the Take Profit is executed before. The downside is that the position is doubled in size. 'ACTIVATE DIVIDE TP': Divide the size of the TP in half. More probability of the trade closing but less profit.
█ STOP LOSS and RISK MANAGEMENT.
A good risk management is what can make your equity go up or be liquidated.
The % risk is the percentage of our capital that we are willing to lose by operation. This is recommended to be between 1-5%.
% Risk: (% Stop Loss x % Equity per trade x Leverage) / 100
First the strategy is calculated with Stop Loss, then the risk per operation is determined and from there, the amount per operation is calculated and not vice versa.
In this script you can use a normal Stop Loss or one according to the ATR. Also activate the option to trigger it earlier if the risk percentage is reached. '% RISK ALLOWED'
'STOP LOSS CONFIRMED': The Stop Loss is only activated if the closing of the previous bar is in the loss limit condition. It's useful to prevent the SL from triggering when they do a ‘pump’ to sweep Stops and then return the price to the previous state.
█ BACKTEST
The objective of the Backtest is to evaluate the effectiveness of our strategy. A good Backtest is determined by some parameters such as:
- RECOVERY FACTOR: It consists of dividing the 'net profit' by the 'drawdown’. An excellent trading system has a recovery factor of 10 or more; that is, it generates 10 times more net profit than drawdown.
- PROFIT FACTOR: The ‘Profit Factor’ is another popular measure of system performance. It's as simple as dividing what win trades earn by what loser trades lose. If the strategy is profitable then by definition the 'Profit Factor' is going to be greater than 1. Strategies that are not profitable produce profit factors less than one. A good system has a profit factor of 2 or more. The good thing about the ‘Profit Factor’ is that it tells us what we are going to earn for each dollar we lose. A profit factor of 2.5 tells us that for every dollar we lose operating we will earn 2.5.
- SHARPE: (Return system - Return without risk) / Deviation of returns.
When the variations of gains and losses are very high, the deviation is very high and that leads to a very poor ‘Sharpe’ ratio. If the operations are very close to the average (little deviation) the result is a fairly high 'Sharpe' ratio. If a strategy has a 'Sharpe' ratio greater than 1 it is a good strategy. If it has a 'Sharpe' ratio greater than 2, it is excellent. If it has a ‘Sharpe’ ratio less than 1 then we don't know if it is good or bad, we have to look at other parameters.
- MATHEMATICAL EXPECTATION: (% winning trades X average profit) + (% losing trades X average loss).
To earn money with a Trading system, it is not necessary to win all the operations, what is really important is the final result of the operation. A Trading system has to have positive mathematical expectation as is the case with this script: ME = (0.87 x 30.74$) - (0.13 x 56.16$) = (26.74 - 7.30) = 19.44$ > 0
The game of roulette, for example, has negative mathematical expectation for the player, it can have positive winning streaks, but in the long term, if you continue playing you will end up losing, and casinos know this very well.
PARAMETERS
'BACKTEST DAYS': Number of days back of historical data for the calculation of the Backtest.
'ENTRY TYPE': For '% EQUITY' if you have $ 10,000 of capital and select 7.5%, for example, your entry would be $ 750 without leverage. If you select CONTRACTS for the 'BTCUSDT' pair, for example, it would be the amount in 'Bitcoins' and if you select 'CASH' it would be the amount in $ dollars.
'QUANTITY (LEVERAGE 1X)': The amount for an entry with X1 leverage according to the previous section.
'MAXIMUM LEVERAGE': It's the maximum allowed multiplier of the quantity entered in the previous section according to the volume condition.
The settings are for Bitcoin at Binance Futures (BTC: USDTPERP) in 15 minutes.
For other pairs and other timeframes, the settings have to be adjusted again. And within a month, the settings will be different because we all know the market and the trend are changing.

BuyHigh-SellLow StrategyYeah. You read it right. It's not a mistake. It is buy high and sell low strategy.
Main entry condition is to buy when price hits 40 day Donchian channel top. This is combined with my other regular filters which are aligned moving average and new high/low filter and yearly high/low filter.
Exit condition can be based on two things:
Donchian channel : Set appropriate DonchianExitLength. Lower line of donchian channel acts as trailing stop.
ATR Based trailing stop : Select appropriate ATR multiplier and length.
What a surprise!! You can buy high, sell low and still make money.
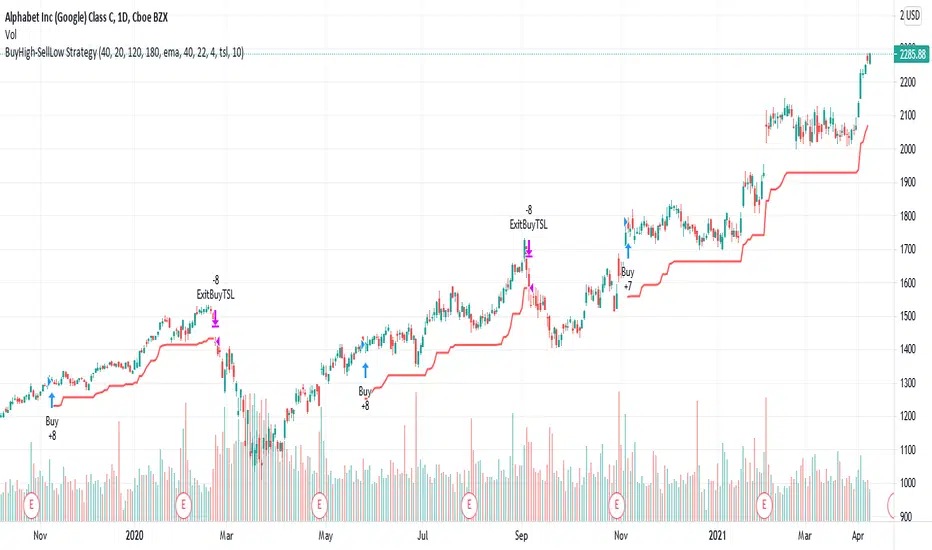
Chandelier Exit | SAR/Long Only (4CUP)As introduced by StockCharts.com, Chandelier Exit was developed by Charles Le Beau and featured in Alexander Elder's books, this sets a trailing stop-loss based on the Average True Range (ATR).
Chandelier Exit can be formulated as a stop-and-reverse (SAR) or as a traditional trailing stop-loss version shown by Stockcharts.com.
The main difference is that, in SAR version, the indicator is usually formulated in a higher of previous or spot indicator (HPS) for long and lower of previous and spot indicator (LPS) for short position.
This indicator is coded to show both the SAR version and the traditional one shown by Stockcharts.com (for long position) by simply clicking a tick in the Version box.
The ATR multiplier is relaxed to allow non-integer input, like 3.5, 4.25, ... for a greater flexibility to tailor your best-fit exit strategy.
If you find this indicator is useful to you, Star it, Follow, Donate, Like and Share.
Your support is a highly motivation for me.
Gap Down Reversal StrategyA "Gap down Reversal" is when the current days candle, opens, below the prior days close, and "finishes up" on the day with the close greater than the open. This type of price action can provide traders with favorable entry points to trade long, as anyone who was short the prior day, can get squeezed or panic out of the trade as they would see profits erode quickly from the gap down at the open.
Strategy results are shown on SHOP with 10k starting capital and 10k per trade. The strategy enters at next days close after the gap down reversal fires off, and a 5% trailing stop order is also executed. This is important to understand when experimenting with different trailing stops on different symbols and observing results to find the most viable strategy. The discretionary trader may choose to enter at the close, or at the next days open, so understand results are not calculated for those entry points.
You also may alter the start date of the strategy, so you can include, or exclude certain dates.
Experiment with different stops and symbols! More volatile symbols most likely will need looser stops and Vice Versa. Concentrate on symbols in up trends, as "the dips" usually get consistently bought in these names, but hard reversals in downtrends can happen as well.
Any questions/concerns please let me know and happy trading.

Williams Fractal Trailing StopsUnlike the built-in version, you can configure how many bars it takes to confirm a fractal. This indicator plots all Williams high and low fractals, and a stop line that trails the fractals up and down. Includes long and short stop alerts. You can choose whether the trail flips long-short based on the price being exceeded within a candle or on candle close. This indicator deals only with fractals and doesn't get into the Alligator or anything else.
I've commented it extensively, so that it might be useful for people learning Pinescript. Enjoy!
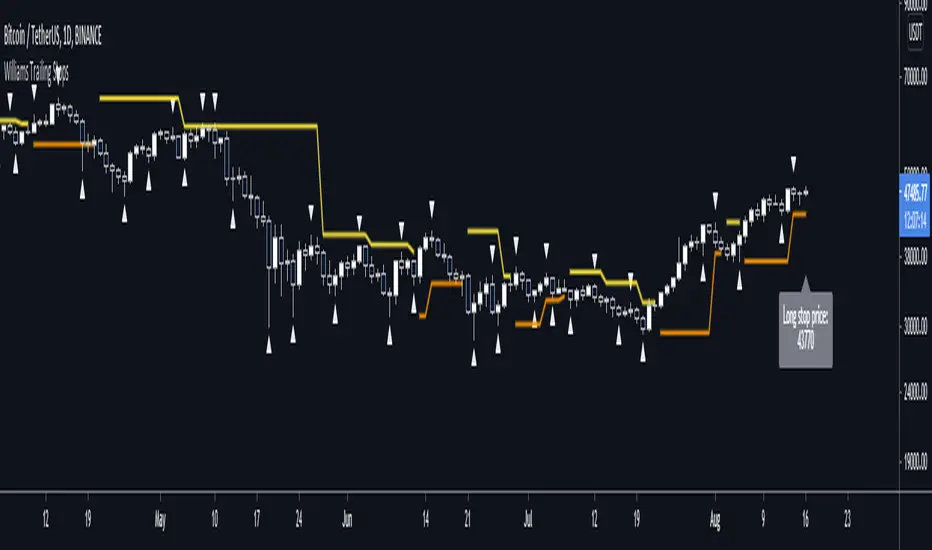
Why is it ok to backtest on TradingView from now on!TradingView backtester has bad reputation. For a good reason - it was producing wrong results, and it was clear at first sight how bad they were.
But this has changed. Along with many other improvements in its PineScript coding capabilities, TradingView fixed important bug, which was the main reason for miscalculations. TradingView didn't really speak out about this fix, so let me try :)
Have a look at this short code of a swing trading strategy (PLEASE DON'T FOCUS ON BACKTEST RESULTS ATTACHED HERE - THEY DO NOT MATTER). Sometimes entry condition happens together with closing condition for the already ongoing trade. Example: the condition to close Long entry is the same as a condition to enter Short. And when these two aligned, not only a Long was closed and Short was entered (as intended), but also a second Short was entered, too!!! What's even worse, that second short was not controlled with closing conditions inside strategy.exit() function and it very often lead to losses exceeding whatever was declared in "loss=" parameter. This could not have worked well...
But HOORAY!!! - it has been fixed and won't happen anymore. So together with other improvements - TradingView's backtester and PineScript is now ok to work with on standard candlesticks :)
Yep, no need to code strategies and backtest them on other platforms anymore.
----------------
Having said the above, there are still some pitfalls remaining, which you need to be aware of and avoid:
Don't backtest on HeikenAshi, Renko, Kagi candlesticks. They were not invented with backtesting in mind. There are still using wrong price levels for entries and therefore producing always too good backtesting results. Only standard candlesticks are reliable to backtest on.
Don't use Trailing Stop in your code. TradingView operates only on closed candlesticks, not on tick data and because of that, backtester will always assume price has first reached its favourable extreme (so 'high' when you are in Long trade and 'low' when you are in Short trade) before it starts to pull back. Which is rarely the truth in reality. Therefore strategies using Trailing Stop are also producing too good backtesting results. It is especially well visible on higher timeframe strategies - for some reason your strategy manages to make gains on those huge, fat candlesticks :) But that's not reality.
"when=" inside strategy.exit() does not work as you would intuitively expect. If you want to have logical condition to close your trade (for example - crossover(rsi(close,14),20)) you need to place it inside strategy.close() function. And leave StopLoss + TakeProfit conditions inside strategy.exit() function. Just as in attached code.
If you're working with pyramiding, add "process_orders_on_close=ANY" to your strategy() script header. Default setting ("=FIFO") will first close the trade, which was opened first, not the one which was hit by Stop-Loss condidtion.
----------------
That's it, I guess :) If you are noticing other issues with backtester and would like to share, let everyone know in comments. If the issue is indeed a bug, there is a chance TradingView dev team will hear your voice and take it into account when working on other improvements. Just like they heard about the bug I described above.
P.S. I know for a fact that more improvements in the backtesting area are coming. Some will change the game even for non-coding traders. If you want to be notified quickly and with my comment - gimme "follow".
